

Please refer to Appendix B for select frames of output from our program.
Click Here for the MPEG Videos
EFFICIENCY OF THE PROGRAM
To test the efficiency of the program we made several test runs with varying parameters. During
each test run the efficiency of the program was measured in two ways. First, we used a Silicon
Graphics utility called “pixie” to profile what each thread of execution was spending its time doing.
We found that as the number of threads increased, the efficiency of the program decreased even
though the wall clock time becomes shorter. In these graphs blue represents Input / Output (I/O),
green represents the time used processing neuron data, yellow represents program initialization and
the overhead of running multiple threads, and red represents time spent spin locking. All tests were
performed outputting 600 frames at various widths and heights. The results from this series of tests
at 300x300 are displayed in figures R.2 through R.8.
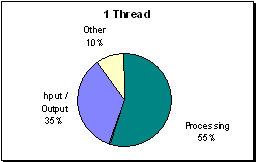
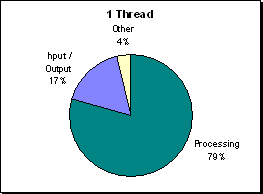
(Figure R.2 - A profile of processor utilization at
300x300. On a single processor the program is most
efficient.)
On a sing processor the program was very efficient, because there was no overhead from initializing
threads or any waiting for work. More time is spent processing than either initializing or I/O.
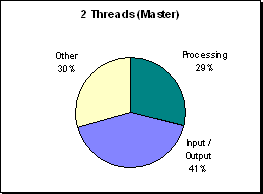
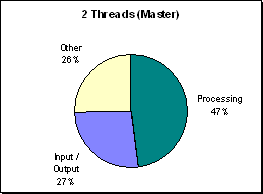
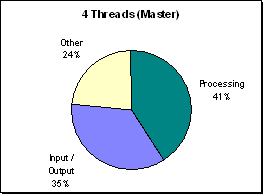
(Figure R.3 - A profile of processor utilization at
300x300 on 2 processors. This master process took
part in one half of the parallel region's
computations.)
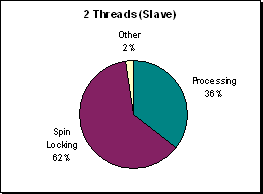
(Figure R.4 - A profile of processor utilization at
300x300 on 2 processors. More time is spent
waiting for work than doing work.)
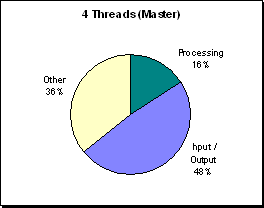
(Figure R.5 - A profile of processor utilization at
300x300 on 4 processors. Processors each have one
fourth of the parallel computations.)
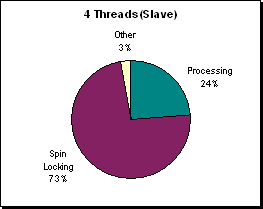
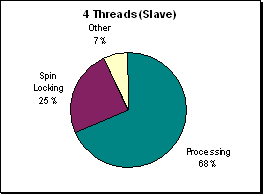
(Figure R.6 - A profile of processor utilization at
300x300 on 4 processors. The waiting condition of
the slave threads worsens.)

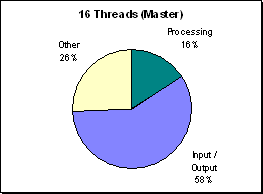
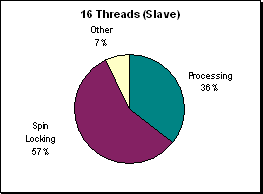
(Figure R.7 - A profile of processor utilization at
300x300 on 16 processors. Serial computations are
primarily what the master thread is doing.)
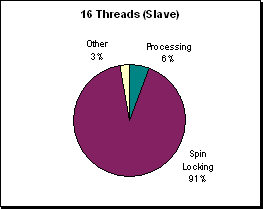
(Figure R.8 - A profile of processor utilization at
300x300 on 16 processors. Now only a small
fraction of the parallel computations are taken care of
by each slave thread, the parallel region is very fast
while the serial region remains the same speed. Slave
threads spend 91% of their time waiting.)
In a 300x300 run, as the number of threads and processors increase, the slave threads spend more
time waiting for work. The parallel region of the program takes less and less time as the serial region
of the program takes a constant amount of time.
The graphs of processor utilization for a 1200x1200 run outputting 600 frames are displayed in
figures R.9 through R.15
(Figure R.9 - A profile of processor utilization at
1200x1200 on 1 processor. Again, the most efficient run.
(Figure R.10 - A profile of processor utilization at
1200x1200. At this width and height the same
division of work takes place.)
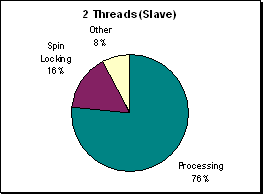
Figure R.11 - A profile of processor utilization at
1200x1200. When there is more work to do in a
wider and higher data set the processor spends most
of its time processing.)
(Figure R.12 - A profile of processor utilization at
1200x1200. The work is being divided as in the
300x300 run.)
(Figure R.13 - A profile of processor utilization at
1200x1200. There is more spin locking taking
place in this run but to a relatively lesser degree than
at 300x300 because there is more processing to do.)
(Figure R.14 - A profile of processor utilization at
1200x1200. Wall clock time has decreased
significantly but at the price of running on 16
processors.)
(Figure R.15 - A profile of processor utilization at
1200x1200. When there is more work for each
thread to do running on multiple processors becomes
much more efficient with the reduction of time spent
spin locking.)
Although a 1200x1200 run takes more wall clock time than a 300x300 run the program is more
efficient because there are many more computations for the threads to divide amongst themselves,
decreasing the percentage of time each processor spends spin locking. As the program becomes
more complex in its computations the efficiency of the program on multiple processors will greatly
increase.
Next, we used a UNIX utility called "time" to measure the wall clock time and the CPU time the
program took to complete. The results of these tests are displayed in figures R.16 and R.17.
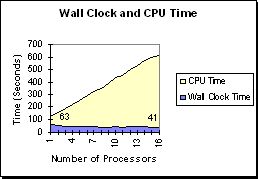
(Figure R.16 - A display of CPU Time versus
Wall Clock Time in a 300x300 simulation. The
program takes less time but becomes less efficient.)
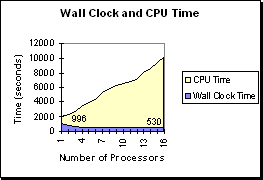
(Figure R.17 - A display of CPU Time versus
Wall Clock Time in a 1200x1200 simulation.
As in the 300x300 run the program becomes less
efficient with more processors but since there are
more computations this run is relatively more
efficient. )