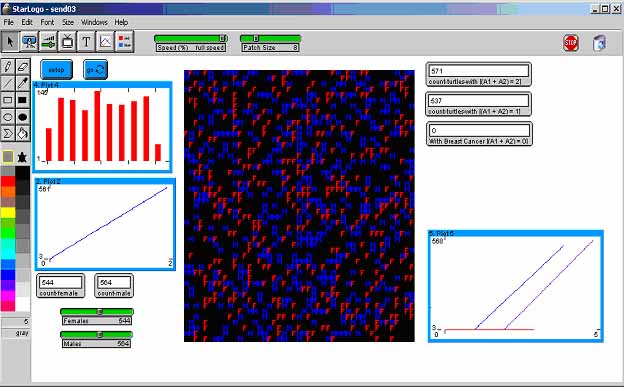
The model itself allows the controller to manipulate the initial settings. One can also monitor the frequency, age, and distribution of the breast cancer gene through the graphs displayed in the following figure. Figure 1: Breast Cancer Model Introduction Table 1 Problem Definition Problem Solution Results Table 2 Figure 1 Conclusions Recommendations Acknowledgments


 SER/SFPS Career Academy